
Local Government
Support policy decisions to guide affordable housing development and investment.
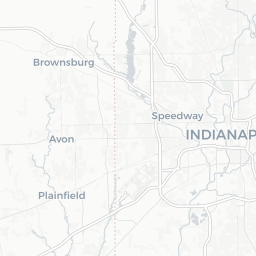
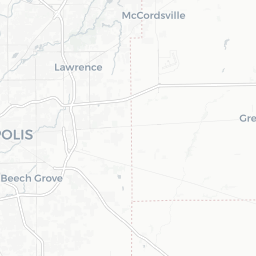
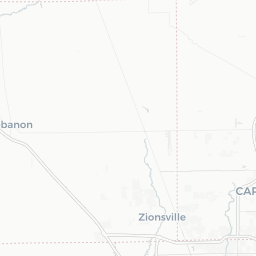
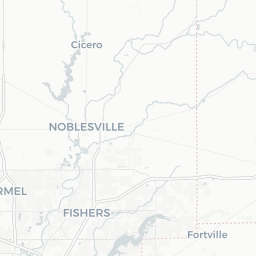
46107, 46113, 46183, 46201, 46202, 46203, 46204, 46205, 46206, 46207, 46208, 46214, 46216, 46217, 46218, 46219, 46220, 46221, 46222, 46224, 46225, 46226, 46227, 46228, 46229, 46230, 46231, 46234, 46235, 46236, 46237, 46239, 46240, 46241, 46242, 46244, 46247, 46249, 46250, 46253, 46254, 46256, 46259, 46260, 46268, 46278, 46282, 46290, 46298
Affordable Housing Market Analysis Report
Indianapolis Metropolitan Area ZIP Code Analysis
Executive Summary
This report analyzes demographic and housing characteristics across 49 ZIP codes in the Indianapolis metropolitan area to support affordable housing policy decisions. The analysis reveals significant housing affordability challenges, with a substantial portion of renters experiencing cost burdens and notable income disparities across neighborhoods. The typical area profile shows moderate-income communities with mixed housing tenure and varying degrees of housing cost stress.
Key Demographic Findings from Neighborhood Analysis
Income Distribution Patterns
The neighborhoods analyzed show considerable income variation across the service area. Household income distribution reveals that lower-income brackets are well-represented, with neighborhoods averaging 5.6% of households earning less than $10,000 annually and 4.0% earning $10,000-$14,999 (neighborhood analysis). However, income ranges vary dramatically - some areas have as few as 0.3% of households in the lowest income bracket while others have up to 13.6%.
The middle-income segments show more consistency, with neighborhoods averaging 18.1% of households earning $50,000-$74,999 and 12.8% earning $35,000-$49,999 (neighborhood analysis). Higher-income representation decreases significantly, with only 7.8% of households earning $200,000 or more on average across neighborhoods.
Housing Affordability Crisis Indicators
Rent burden analysis reveals severe affordability challenges across the region. The most striking finding is that neighborhoods average 41.3% of rent-paying households spending 35% or more of their income on rent (neighborhood analysis) - well above the 30% threshold typically considered affordable. This percentage ranges from 26.3% to 75.2% across different areas, indicating widespread but variable housing cost stress.
For homeowners with mortgages, the situation is more manageable but still concerning, with neighborhoods averaging 16.9% spending 35% or more of income on housing costs (neighborhood analysis).
Poverty and Economic Vulnerability
Poverty rates across neighborhoods average 14.1% for all residents (neighborhood analysis), but child poverty is particularly acute at 17.5% on average. Some neighborhoods experience child poverty rates as high as 46.1%, highlighting significant economic vulnerability in certain areas.
Government assistance utilization varies considerably, with neighborhoods averaging 11.2% of households receiving Food Stamp/SNAP benefits, ranging from 1.3% to 26.8% across different areas (neighborhood analysis).
Housing Stock Characteristics
Housing tenure shows a slight preference for homeownership, with neighborhoods averaging 58.6% owner-occupied units and 41.4% renter-occupied units (neighborhood analysis). However, this varies dramatically by area, with homeownership rates ranging from 17.2% to 96.6%.
Housing age and type analysis reveals that neighborhoods average 61.7% single-family detached homes (neighborhood analysis). The housing stock shows significant age diversity, with neighborhoods averaging 14.4% of units built before 1940 and varying percentages across different construction decades.
Target Audience Characteristics from Centroid Analysis
Economic Profile
The weighted demographic profile reveals communities with moderate economic standing. The typical area shows 23.4% of households earning less than $35,000 annually (weighted centroid), indicating a substantial population that would benefit from affordable housing initiatives.
Employment and income stability appears reasonable, with 81.5% of households having earnings (weighted centroid), though 25.6% receive Social Security benefits and 12.1% receive Food Stamp/SNAP benefits, suggesting economic vulnerability among significant portions of the population.
Housing Situation and Needs
Homeownership vs. rental patterns in the typical area show 57.7% owner-occupied units and 42.3% renter-occupied units (weighted centroid), indicating a substantial rental market that requires affordable options.
Housing cost burden remains severe in the typical area, with 41.5% of renters spending 35% or more of their income on rent (weighted centroid). For homeowners with mortgages, 17.4% face similarly high cost burdens (weighted centroid).
Household Composition
Family structure analysis shows 38.1% married-couple households in the typical area (weighted centroid), while 33.0% are female-headed households without a spouse or partner present. This suggests significant need for family-sized affordable housing options.
Age demographics indicate 28.6% of households include children under 18 (weighted centroid), while 24.4% include residents 65 or older, pointing to diverse housing needs across age groups.
Centroid analysis: A composite demographic profile was built by combining census data from each ZIP code according to the population weighting approach above, producing a single representative profile of the areas where population is concentrated.
Data source: All data comes from the American Community Survey (ACS) 5-Year Estimates (2023), published by the U.S. Census Bureau.

Disclaimer: This is a sample report provided for demonstration purposes only and is not intended for use in business or investment decisions. Automate317 LLC assumes no liability for actions taken in reliance on this report.