
Real Estate
Is this a good neighborhood to buy a rental property?
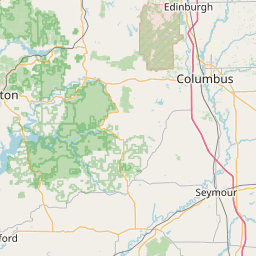
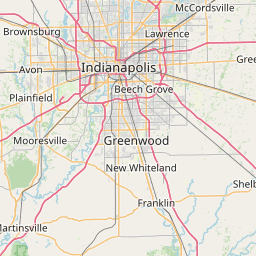
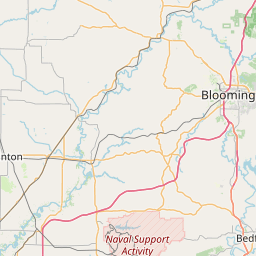
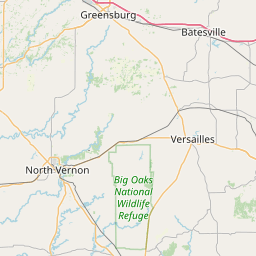
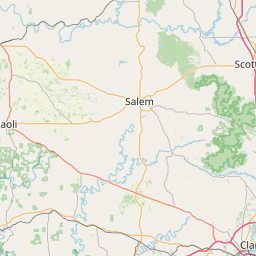
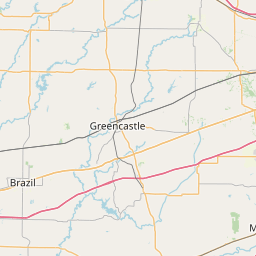
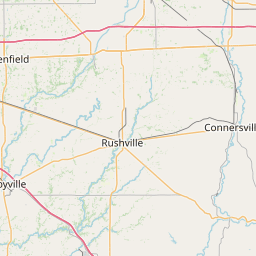
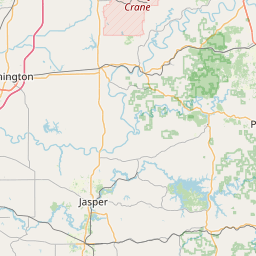
47201, 46124, 46164, 47203, 47232, 47235, 47247, 47264, 47274, 47280, 47448
Real Estate Investment Analysis: Rental Property Market Demographics
Executive Summary
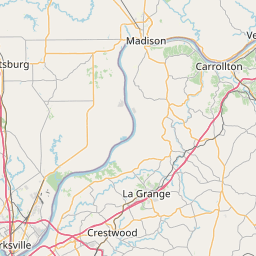
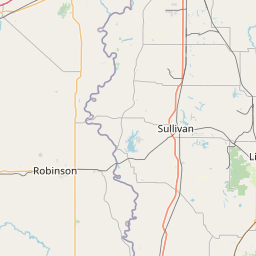
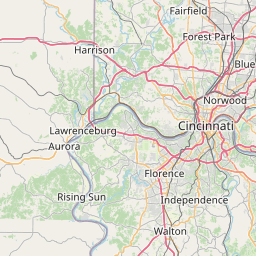
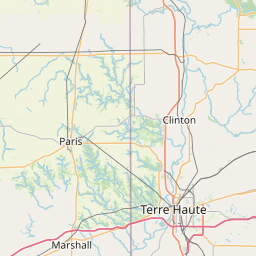
This analysis examines 11 ZIP codes in Indiana to assess their suitability for rental property investment based on demographic and housing market characteristics. The analyzed areas show a mixed rental market with significant variation across ZIP codes. Key findings reveal a moderate rental population (20% of households rent), diverse income levels with strong middle-class representation, and concerning rent burden levels that may indicate both demand pressures and affordability challenges for tenants.
Key Demographic Findings from Neighborhood Analysis
Housing Market Characteristics
Homeownership Dominance: The neighborhood average shows 79.7% of housing units are owner-occupied, with renter-occupied units comprising only 20.3% of the market. However, this varies significantly across ZIP codes, with renter occupancy ranging from as low as 3.6% to as high as 35.1%, indicating some areas have much stronger rental markets than others.
Rent Burden Levels: Among renters, 37.7% pay more than 35% of their income toward rent (the neighborhood average), which exceeds the standard 30% affordability threshold. This suggests either strong rental demand driving up prices or a shortage of affordable rental units. Only 28.1% of renters pay less than 15% of income on rent, indicating limited availability of low-cost rental options.
Property Values: Owner-occupied homes show a broad value distribution. The neighborhood average reveals 21.8% of homes valued between $150,000-$199,999 and 20.7% valued between $200,000-$299,999, suggesting moderate property acquisition costs for investors. Higher-end properties ($500,000+) represent only 9.2% of the market.
Income Profile
Middle-Class Focus: The income distribution shows strong representation in middle-income brackets, with 17.2% of households earning $100,000-$149,999 and 16.3% earning $50,000-$74,999 (neighborhood averages). Lower-income households (under $25,000) comprise 15.7% of the population, while higher earners ($150,000+) represent 15.6%.
Employment Stability: The neighborhood average shows 76.5% of households have earnings from employment, with 59.2% of the adult population employed. The unemployment rate averages 3.9%, indicating relatively stable economic conditions across the analyzed areas.
Population Stability
Low Mobility: The neighborhood average reveals 85.7% of residents lived in the same house one year ago, indicating low population turnover. Only 14.3% moved within the past year, with most moves (6.6%) occurring within the same county. This suggests stable rental demand but potentially slower tenant turnover.
Target Audience Characteristics from Centroid Analysis
The weighted centroid analysis reveals the typical demographic profile of areas where rental investment opportunities are concentrated:
Rental Market Size: The centroid shows 20.3% renter occupancy, confirming a modest but consistent rental market across the weighted areas.
Renter Financial Profile: Among renters in the weighted average area, 37.7% are rent-burdened (paying 35%+ of income on rent), while 28.1% pay less than 15% of income on rent. This polarization suggests both premium rental opportunities and demand for affordable options.
Educational Attainment: The centroid reveals 23.3% of adults hold bachelor's degrees or higher, with 37.9% having completed high school as their highest education level. This indicates a mix of professional and skilled working-class residents.
Income Diversity: The weighted profile shows strong middle-income representation, with the largest groups earning $100,000-$149,999 (17.2%) and $50,000-$74,999 (16.3%). Combined, households earning $50,000-$149,999 represent 49% of the population.
Economic Support Usage: The centroid shows 8.2% of households receive SNAP benefits and 4.8% receive Supplemental Security Income, indicating some economic vulnerability that could affect rental payment reliability.
Weighting Approach: ZIP codes were weighted using client-provided weights (such as customer counts or transaction volume), so areas with more business activity have a greater influence on the composite profile.
Neighborhood Analysis: Descriptive statistics (averages, ranges, spread) were calculated across all analyzed ZIP codes to characterize the overall demographics of the service area.
Centroid Analysis: A composite demographic profile was built by combining census data from each ZIP code according to the weighting approach above, producing a single representative profile of the areas where the audience is concentrated.
Data Source: All data comes from the American Community Survey (ACS) 5-Year Estimates (2023), published by the U.S. Census Bureau.
Important Disclaimer: This report is based on area-level census data aggregated by ZIP code, NOT data about specific individuals. The findings describe the communities where the client's ZIP code weighting indicates their audience lives, but individual people within those areas may differ from the area averages. These insights should inform strategy but not be treated as facts about any individual customer or potential tenant. This analysis reflects demographic patterns and should not be used to make assumptions about specific individuals' characteristics or creditworthiness.
Disclaimer: This is a sample report provided for demonstration purposes only and is not intended for use in business or investment decisions. Automate317 LLC assumes no liability for actions taken in reliance on this report.