
Nonprofit
Identify high-potential donor neighborhoods for childhood hunger relief programs
60601, 60602, 60604, 60610, 60614, 60657, 60613, 60640, 60625, 60618
Demographic Analysis Report: High-Potential Donor Neighborhoods for Childhood Hunger Relief Programs
Executive Summary
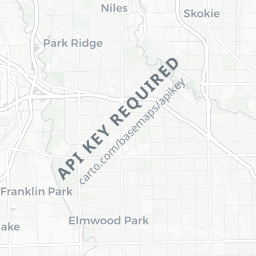
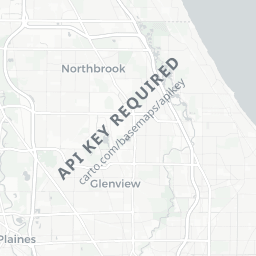
This analysis examines 10 Chicago ZIP codes (60601, 60602, 60604, 60610, 60614, 60657, 60613, 60640, 60625, 60618) to identify demographic characteristics of high-potential donor neighborhoods for childhood hunger relief programs. The analyzed areas represent diverse urban communities with populations ranging from 1,127 to 91,896 residents per ZIP code. Key findings reveal affluent, highly educated neighborhoods with significant giving capacity alongside areas with demonstrated need for childhood hunger relief services.
Key Demographic Findings from Neighborhood Analysis
Income Distribution
The neighborhoods show substantial economic diversity. Across all analyzed ZIP codes, 22.7% of households earn $200,000 or more annually (neighborhood average), indicating strong philanthropic capacity. However, income inequality is evident, with 4.1% of households earning less than $10,000 (neighborhood average) and 7.4% of households receiving Food Stamp/SNAP benefits (neighborhood average).
The poverty data reveals particular concern for families with children: 8.6% of families with children under 18 live below the poverty line (neighborhood average), with some ZIP codes showing rates as high as 22.3%. Single-mother households face the greatest challenges, with 21.0% living in poverty (neighborhood average).
Education Levels
The analyzed neighborhoods demonstrate exceptional educational attainment. 70.4% of adults have bachelor's degrees or higher (neighborhood average), significantly above national averages. Graduate and professional degree holders comprise 33.2% of the population (neighborhood average), suggesting a demographic likely to support charitable causes and understand complex social issues.
Age Demographics and Child Population
Children represent a meaningful portion of these communities. 13.6% of residents are under 18 (neighborhood average), with 4.8% under age 5 and 3.9% ages 5-9 (neighborhood averages). The presence of families is confirmed by 15.5% of households having children under 18 (neighborhood average).
Young professionals dominate the adult population, with 31.3% of residents ages 25-34 (neighborhood average), representing potential donors in their prime earning years.
Employment and Economic Stability
These neighborhoods show strong economic participation, with 78.4% of adults in the labor force (neighborhood average) and 75.1% employed (neighborhood average). The unemployment rate averages 3.3%, indicating economic stability that supports charitable giving capacity.
Target Audience Characteristics from Centroid Analysis
The weighted centroid analysis reveals the typical demographic profile of areas where potential donors are concentrated:
High-Income Professional Households
The centroid shows 21.7% of households earn $200,000 or more, with an additional 17.8% earning $100,000-$149,999. Combined, 39.5% of households earn six figures or more, indicating substantial discretionary income for charitable contributions.
Highly Educated Population
Educational attainment in the centroid areas is exceptionally high: 70.1% of adults have bachelor's degrees or higher, with 30.4% holding graduate or professional degrees. This education level correlates with awareness of social issues and propensity for charitable giving.
Young Professional Demographics
The age distribution shows 27.7% of residents are ages 25-34, representing young professionals likely building careers and establishing giving patterns. An additional 16.4% are ages 35-44, capturing established professionals in peak earning years.
Family Presence with Children
The centroid reveals 14.8% of the population is under 18, with 12.5% of households having children under 18. This family presence suggests potential emotional connection to childhood hunger issues.
Employment Stability
77.3% of adults participate in the labor force with 73.9% employed, demonstrating the economic stability necessary for sustained charitable giving.
Household Composition
The centroid shows 31.4% married-couple households and 32.5% single-person female households. The high proportion of single-person households (both male and female combined represent nearly 60% of households) suggests disposable income without family financial obligations.



Disclaimer: This is a sample report provided for demonstration purposes only and is not intended for use in business or investment decisions. Automate317 LLC assumes no liability for actions taken in reliance on this report.