
Home Services
Improve ad targeting for a cleaning service
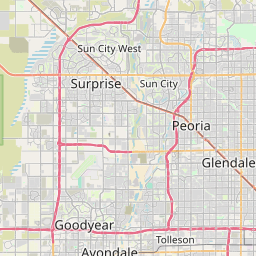
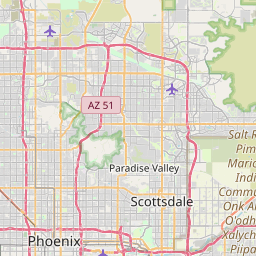
85027, 85022, 85023, 85024, 85053, 85083, 85085, 85308, 85310
Demographic Analysis Report: Phoenix-Area ZIP Codes
Marketing Analytics for Home Cleaning Service
Executive Summary
This analysis examines the demographic characteristics of nine Phoenix-area ZIP codes (85027, 85022, 85023, 85024, 85053, 85083, 85085, 85308, 85310) to improve ad targeting for a cleaning service. The study reveals a service area characterized by middle-to-upper-middle-class households, high homeownership rates, and a substantial population of working professionals with college degrees. The weighted analysis indicates the target audience lives in areas with median household incomes primarily in the $100,000-$199,999 range, with nearly 40% of residents holding bachelor's degrees or higher.
Key Demographic Findings from Neighborhood Analysis
Income Distribution Across Service Areas
The neighborhood analysis reveals significant income diversity across the nine ZIP codes. Household counts range from 6,854 to 25,693 per ZIP code, with an average of 14,201 households.
Higher-income segments show the strongest representation: households earning $100,000-$149,999 average 19.8% across neighborhoods, while those earning $200,000 or more average 15.2% but show high variation (ranging from 5.8% to 33.9% across different ZIP codes). This wide spread indicates some areas are significantly more affluent than others.
Lower-income segments remain relatively small: households earning less than $10,000 average only 3.4% across neighborhoods, while those earning $10,000-$14,999 represent just 1.5% on average.
Employment and Education Characteristics
The service area demonstrates strong employment stability, with an average of 70.2% of adults participating in the labor force across neighborhoods. Employment rates among those seeking work remain healthy, with unemployment averaging just 3.3% across ZIP codes.
Educational attainment is notably high throughout the region. College graduates (bachelor's degree or higher) average 39.2% across neighborhoods but vary significantly by area (ranging from 25.9% to 51.8%). High school graduation rates are consistently strong, averaging 93.6% across all ZIP codes.
Housing and Household Structure
Homeownership rates average 67.2% across neighborhoods but show substantial variation, ranging from 51.0% to 92.9% depending on the ZIP code. This suggests a mix of established residential communities and areas with more transient populations.
Family composition trends toward traditional structures, with married-couple households averaging 50.5% across neighborhoods. However, single-person households represent a significant segment, with female householders living alone averaging 14.0% and male householders living alone averaging 11.2%.
Commuting and Work Patterns
Remote work adoption is notably high across the service area, with workers working from home averaging 21.7% across neighborhoods (ranging from 14.0% to 30.3%). Traditional car commuting remains dominant, with 65.6% driving alone and 8.7% carpooling on average.
Target Audience Characteristics from Centroid Analysis
The weighted centroid analysis reveals the demographic profile of areas where the cleaning service's audience is most concentrated:
Economic Profile
The typical audience area shows an affluent, economically stable population. The weighted profile indicates 19.8% of households earn $100,000-$149,999, while 15.2% earn $200,000 or more. Combined, over 46% of households in the weighted audience profile earn above $100,000 annually.
Only 9.3% of households in the audience profile earn below $35,000, indicating limited presence in lower-income segments. The high rate of households with earnings (84.0%) demonstrates a working, economically active population.
Education and Employment
The audience profile reveals a highly educated population, with 39.2% holding bachelor's degrees or higher and 15.0% having graduate or professional degrees. Nearly all residents (93.6%) have completed high school.
Employment characteristics show 66.8% of the adult population is employed, with strong representation in professional occupations. Management, business, science, and arts occupations represent 47.4% of employed workers in the audience profile, indicating a white-collar professional base.
Housing and Demographics
The audience profile shows 67.2% homeownership, suggesting established residents with long-term community ties. The population skews slightly female (50.4% vs 49.6% male) with a mature age structure - 23.0% are under 18, while 13.5% are 65 or older.
Married-couple households represent 50.5% of the audience profile, with 21.3% including children under 18. This indicates a substantial family-oriented demographic.
Lifestyle Indicators
Remote work adoption is exceptionally high in the audience profile, with 21.7% of workers primarily working from home. This suggests a population of knowledge workers with flexible schedules who may value time-saving services like cleaning.
Traditional commuting patterns dominate for non-remote workers, with 65.6% driving alone and minimal public transit use (0.9%), indicating a suburban/car-dependent lifestyle.
Weighting Approach
ZIP codes in this analysis were weighted using client-provided weights reflecting business activity levels, such as customer counts or transaction volume. Areas generating more business activity received proportionally greater influence in the composite demographic profile, ensuring the analysis reflects where the audience is actually concentrated rather than treating all areas equally.
Neighborhood Analysis
Descriptive statistics including averages, ranges, and variability measures were calculated across all nine analyzed ZIP codes to characterize the overall demographics of the service area. These statistics reveal the diversity and typical characteristics of communities within the broader service region.
Centroid Analysis
A composite demographic profile was constructed by combining American Community Survey census data from each ZIP code according to the business activity weighting described above. This weighted centroid represents the demographic characteristics of areas where the client's audience is most concentrated, providing a single representative profile for targeting purposes.
Data Sources and Limitations
All demographic data comes from the American Community Survey (ACS) 5-Year Estimates (2023), published by the U.S. Census Bureau, representing the most current comprehensive demographic data available at the ZIP code level.
Important Disclaimer - Ecological Fallacy: This analysis is based on area-level census data aggregated by ZIP code, NOT data about individual customers or residents. The findings describe the demographic characteristics of communities where the client's weighted business activity indicates their audience is concentrated. However, individual people within those areas may differ significantly from the area averages presented here. These insights should inform marketing strategy and audience understanding but should not be treated as facts about any specific individual customer. The analysis reveals patterns about places, not people.



Disclaimer: This is a sample report provided for demonstration purposes only and is not intended for use in business or investment decisions. Automate317 LLC assumes no liability for actions taken in reliance on this report.